Seattle Real Estate Market Forecast – Is The Current Market In A Bubble? Are We Headed For Another Real Estate Crash?

I talk to Seattle, WA home buyers and sellers every day and one of the biggest questions on everybody’s mind is, “What is going on with the real estate market? When will prices cool off? Should I wait for six months to buy, in hopes that the market gets better? In fact, a recent survey revealed that many would-be buyers believe there’s a housing bubble beginning to form. If you were burned, or saw your parents burned during the real estate build up and crash caused by the mortgage crisis in 2008, then you may be especially sensitive to the idea that history is repeating itself.
And, if you look at what’s happening in the market now, you might find yourself scratching your head and wondering how long this can go on. Some of our markets in the Seattle area have been experiencing 15% -20% appreciation over the last 12 months, and that is certainly out of the ordinary. What is going on, in reality?
The main thing I want to communicate is that THIS market is very different than it was during the housing crash 15 years ago. I was a real estaet investor with lots of houses and properties during that time, and I survived. We should get through this market cycle relatively unscathed… here’s what you need to know.
4 Reasons This Real Estate Market Cycle Is NOT Like Last Time!
1. Houses Are Not Unaffordable Like They Were During the Housing Boom
Now, if you live in the Seattle or Bellevue area, you might have trouble agreeing with this first part, as the median home prices seem to have been shooting up. In fact, the median home price in Kirkland now is over $1 million bucks. However, market cycles like this are driven not just by local real estate trends, but by national figures as well. Let’s examine those, too.
The home affordability formula has three major parts:
a) The price of the home
b) Wages earned by the purchaser, and
c) The mortgage rate available at the time.
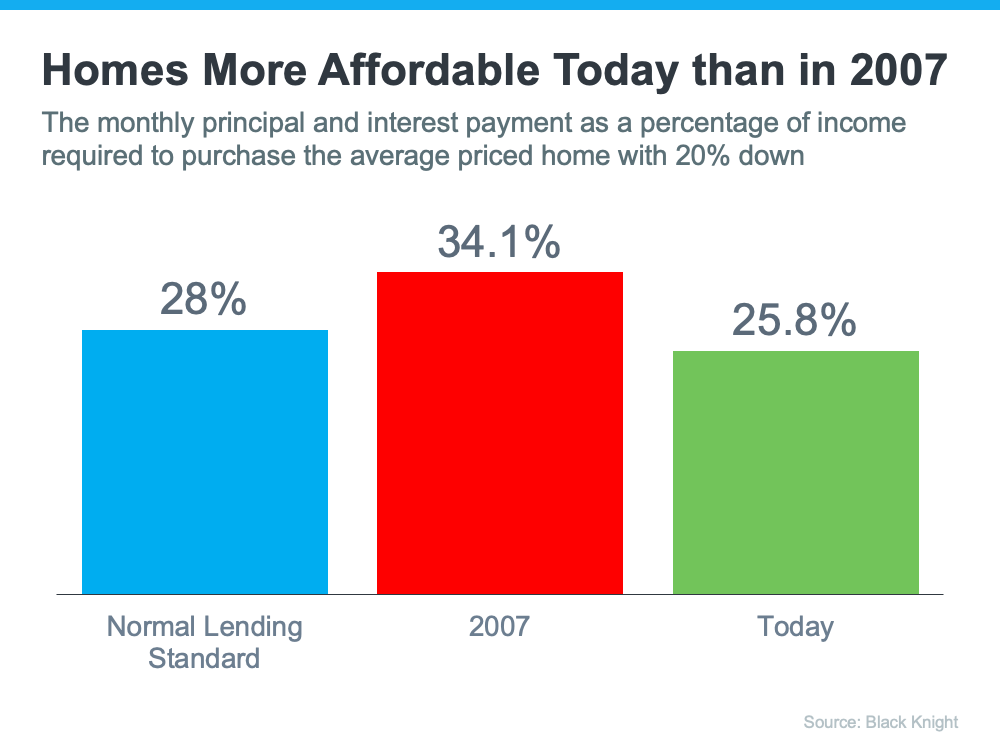
Conventional lending standards dictate that a purchaser should not spend more than one third of their gross income on their mortgage payment.
Fifteen years ago, prices were high, wages were low, and mortgage rates were over 6%.
In 2022, prices are still high. But, wages have increased, and are particularly robust in the Pacific Northwest due to the large highly-paid IT workforce here. And although that many of us are complaining that the mortgage rates are going up from 3% to now 4%… they are still at historically low levels, well below 6%. That means the average purchaser today pays less of their monthly income toward their mortgage payment than they did back then.
In the latest Affordability Report by ATTOM Data, Chief Product Officer Todd Teta addresses that exact point:
“The average wage earner can still afford the typical home across the U.S., but the financial comfort zone continues shrinking as home prices keep soaring and mortgage rates tick upward.”
Affordability isn’t as strong as it was last year, but it’s much better than it was during the boom of 2007. Here’s a chart showing that difference:
Back in 2007, because homes were so expensive, many folks were getting “Creative” when it came to finding ways to buy a property, especially as they had FOMO (Fear of missing out) seeing housing prices rise quickly and worrying if homeownership would slip out of their grasp if they didn’t act quickly.
So, desperate times called for desperate measures, and many people bought homes with sketchy loans… homes they might not have been able to afford if traditional, conservative lending standards had been followed.
2. Mortgage Standards Were Much More Relaxed During the Boom
During the housing bubble, it was much easier to get a mortgage than it is today. As an example, let’s review the number of mortgages granted to purchasers with credit scores under 620. According to credit.org, a credit score between 550-619 is considered “Poor.” In defining those with a score below 620, they explain:
“Credit agencies consider consumers with credit delinquencies, account rejections, and little credit history as subprime borrowers due to their high credit risk.”
Buyers can still qualify for a mortgage with a credit score that low, but they’re considered riskier borrowers. Here’s a graph showing the mortgage volume issued to purchasers with a credit score less than 620 during the housing boom, and the subsequent volume in the 14 years since.
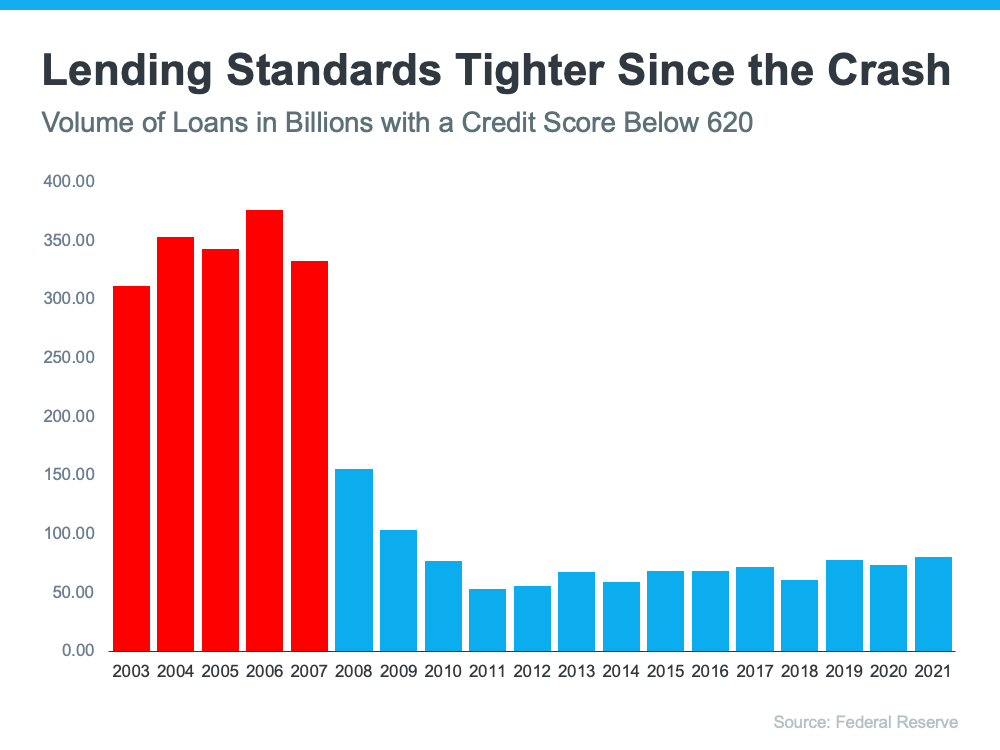
So, back in the 2007 run up, lots of people that “should not have been” getting mortgages, were getting them anyway! Bad/risky mortgages were being written to borrowers with bad credit, undocumented income, and using terms like “adjustable rate mortgages” where they paymetns would start low but then rise to become affordable in the future.
In part the run-up was caused by helping many people buy who were not proven to be a good lending risk… the banks should have known it was only a matter of time until these borrowers were unable to pay, and foreclosures were looming on the horizon.
These days, in 2002, mortgage underwriting standards are nothing like they were pre-2007 leading up to the crash. Purchasers that have bought property with loans initiated in the last ten years are vetted and qualified, making them a safe bet to keep making their payments… which stabilizes the housing market. Let’s take a look at what that means going forward.
3. The Foreclosure Situation Is Nothing Like It Was During the Crash
Sorry all you investment-minded buyers who call me asking for a good deal on a foreclosure property. I love you, and I would love to sell you a foreclosure house, but there just aren’t any available. Yes, it was the big trend in the past, but everyone who might be in financial trouble now is sitting on tons of equity due to the increase in market values, and could easily sell their home at a profit, rather than going through the foreclosure process and taking a loss.
I thought COVID might drive an economic crash that would lead to some good “deals” out there on the market, but this has not been shown to be the case. Quite the opposite – the government has pumped money into the economy making it
The most obvious difference in the foreclosure market compared to 2007 vs 2022 is that a lot of people were facing foreclosure when the real estate market bubble burst. And now there are very few facing foreclosure. The Federal Reserve issues a report showing the number of consumers with a new foreclosure notice. Here are the numbers during the crash compared to today:
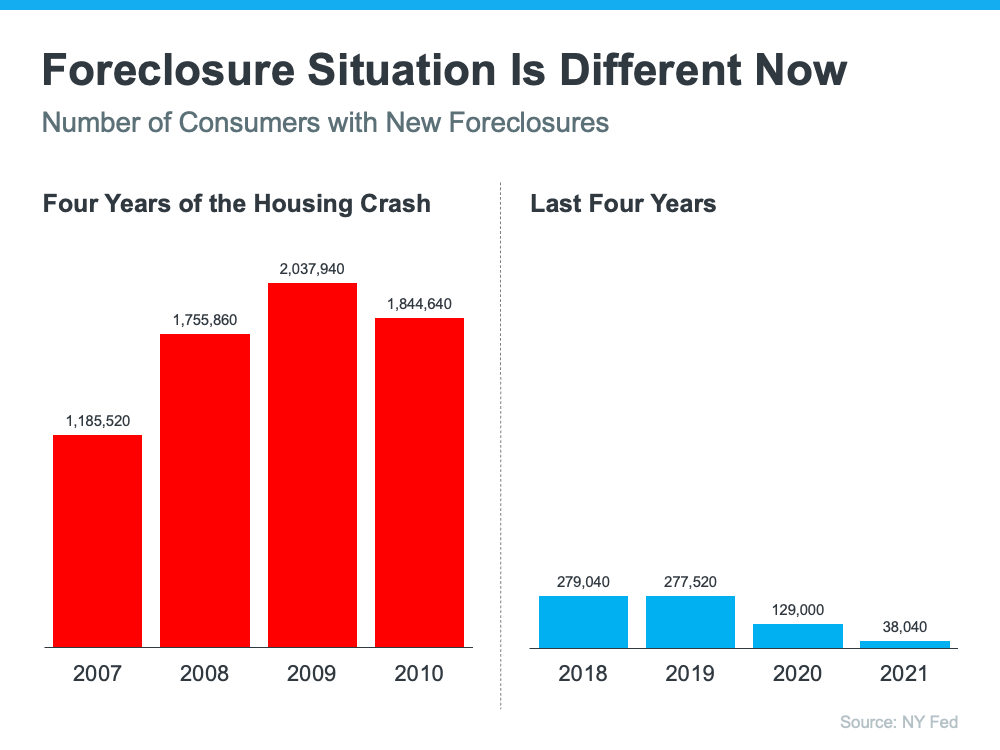
Now, some people did lose jobs and businesses with all the shutdowns and lockdowns of 2019 and 2020. There’s no doubt the 2020 and 2021 numbers were impacted by the forbearance program, which was created to help homeowners facing uncertainty during the pandemic. However, nationwide, there are fewer than 800,000 homeowners left in the program today, and most of those will be able to work out a repayment plan with their banks.
Rick Sharga, Executive Vice President of RealtyTrac, explains:
“The fact that ‘foreclosure starts’ declined despite hundreds of thousands of borrowers exiting the CARES Act mortgage forbearance program over the last few months is very encouraging. It suggests that the ‘forbearance equals foreclosure’ narrative was incorrect.”
Why are there so few foreclosures now? Today, homeowners are equity rich, not tapped out.
In the run-up to the housing bubble, some homeowners were using their homes as personal ATM machines. Many immediately withdrew their equity once it built up. When home values began to fall, some homeowners found themselves in a negative equity situation where the amount they owed on their mortgage was greater than the value of their home. Some of those households decided to walk away from their homes, and that led to a rash of distressed property listings (foreclosures and short sales), which sold at huge discounts, thus lowering the value of other homes in the area.
Homeowners, however, have learned their lessons. Prices have risen nicely over the last few years, leading to over 40% of homes in the country having more than 50% equity. But owners have not been tapping into it like the last time, as evidenced by the fact that national tappable equity has increased to a record $9.9 trillion. With the average home equity now standing at $300,000, what happened last time won’t happen today.
As the latest Homeowner Equity Insights report from CoreLogic explains:
“Not only have equity gains helped homeowners more seamlessly transition out of forbearance and avoid a distressed sale, but they’ve also enabled many to continue building their wealth.”
There will be nowhere near the same number of foreclosures as we saw during the crash. So, what does that mean for the housing market?
4. We Don’t Have a Surplus of Homes on the Market – We Have a Shortage
As you know if you have been in the market to buy a home in the last few years, there aren’t many homes for sale these days. According to conventional wisdom, the supply of inventory needed to sustain a “normal” real estate market is approximately six months.
Anything more than that is an overabundance and will causes prices to depreciate – this is known as a “Buyers Market” because buyers can negotiate hard and pick up homes for less than listing price.
Anything less than that is a shortage and will lead to continued price appreciation – this is known as a “Sellers Market,” and this is what we are experiencing right now… to the extreme, with less than 1 month of inventory in neighborhoods across the Puget Sound.
As the next graph shows, following the 2007 crash, there were an over-abundance of homes for sale from 2007 to 2010 (many of which were short sales and foreclosures), and that caused prices to tumble.
In contrast, today there’s a shortage of inventory, which is causing the acceleration in home values to continue. Inventory will tell the tale, and as long as houses for sale are in short supply, home prices will continue to rise.
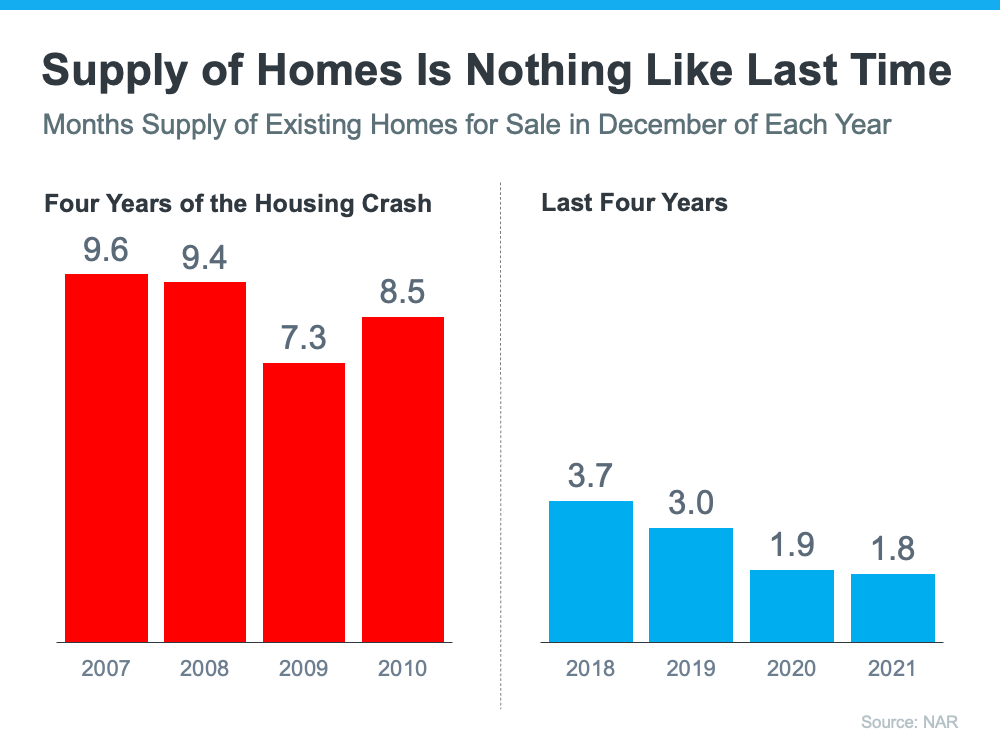
Inventory is nothing like the last time. Prices are rising because there’s a healthy demand for homeownership at the same time there’s a shortage of homes for sale.

Bottom Line
If you’re worried that we’re making the same mistakes that led to the housing crash, the graphs above show data and insights to help alleviate your concerns.
If you are thinking about buying or selling a home, or just have questions about the market that you would like to chat about. Don’t hesitate to reach out. I study economics and market cycles and I’ve been around the block a time or two. I’m a property buyer and seller myself, and I am here to help.